Managing multiple dental clinics is not just about patient care—it’s about data clarity, performance tracking, and fast decision-making.
If your data is scattered across Dentrix, spreadsheets, and manual reports, you’re not alone. Most dental chains struggle to get real-time insights in one place.
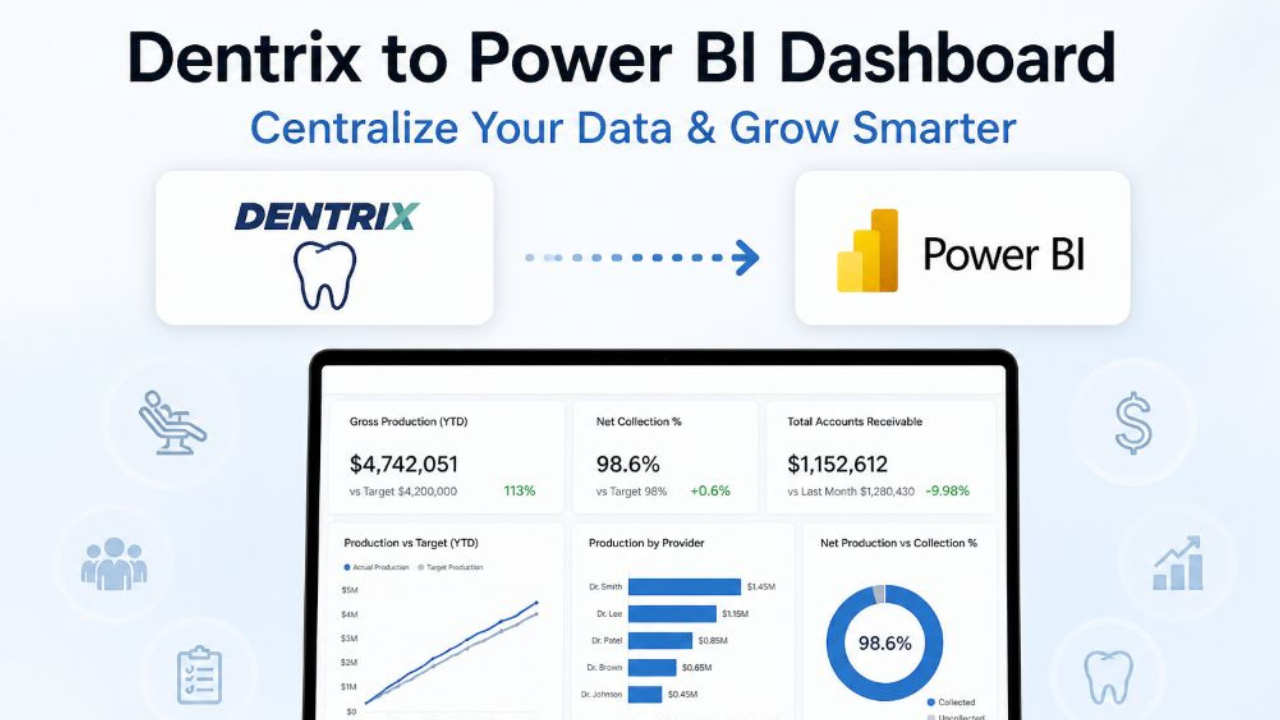
At Hike Branding, we’ve solved this problem by building a powerful Dentrix to Power BI integration (also applicable for OpenDental), helping clinic owners and managers track everything from production to collections—on a single dashboard.
The Problem Dental Chains Face
Data spread across Dentrix + Google Sheets + manual tracking
No unified view of production, collections, or patient activity
Difficult to track doctor-wise performance
Delayed decisions due to lack of real-time insights
Manual reporting = time-consuming + error-prone
Our Solution: Dentrix / OpenDental to Power BI Integration
We built a centralized reporting system where:
Data flows from Dentrix (Desktop G6.2+ or Ascend) into a cloud database
Power BI dashboards visualize insights in real-time or daily sync
Multi-location clinics can track performance across all branches
1. Production & Adjustments Dashboard
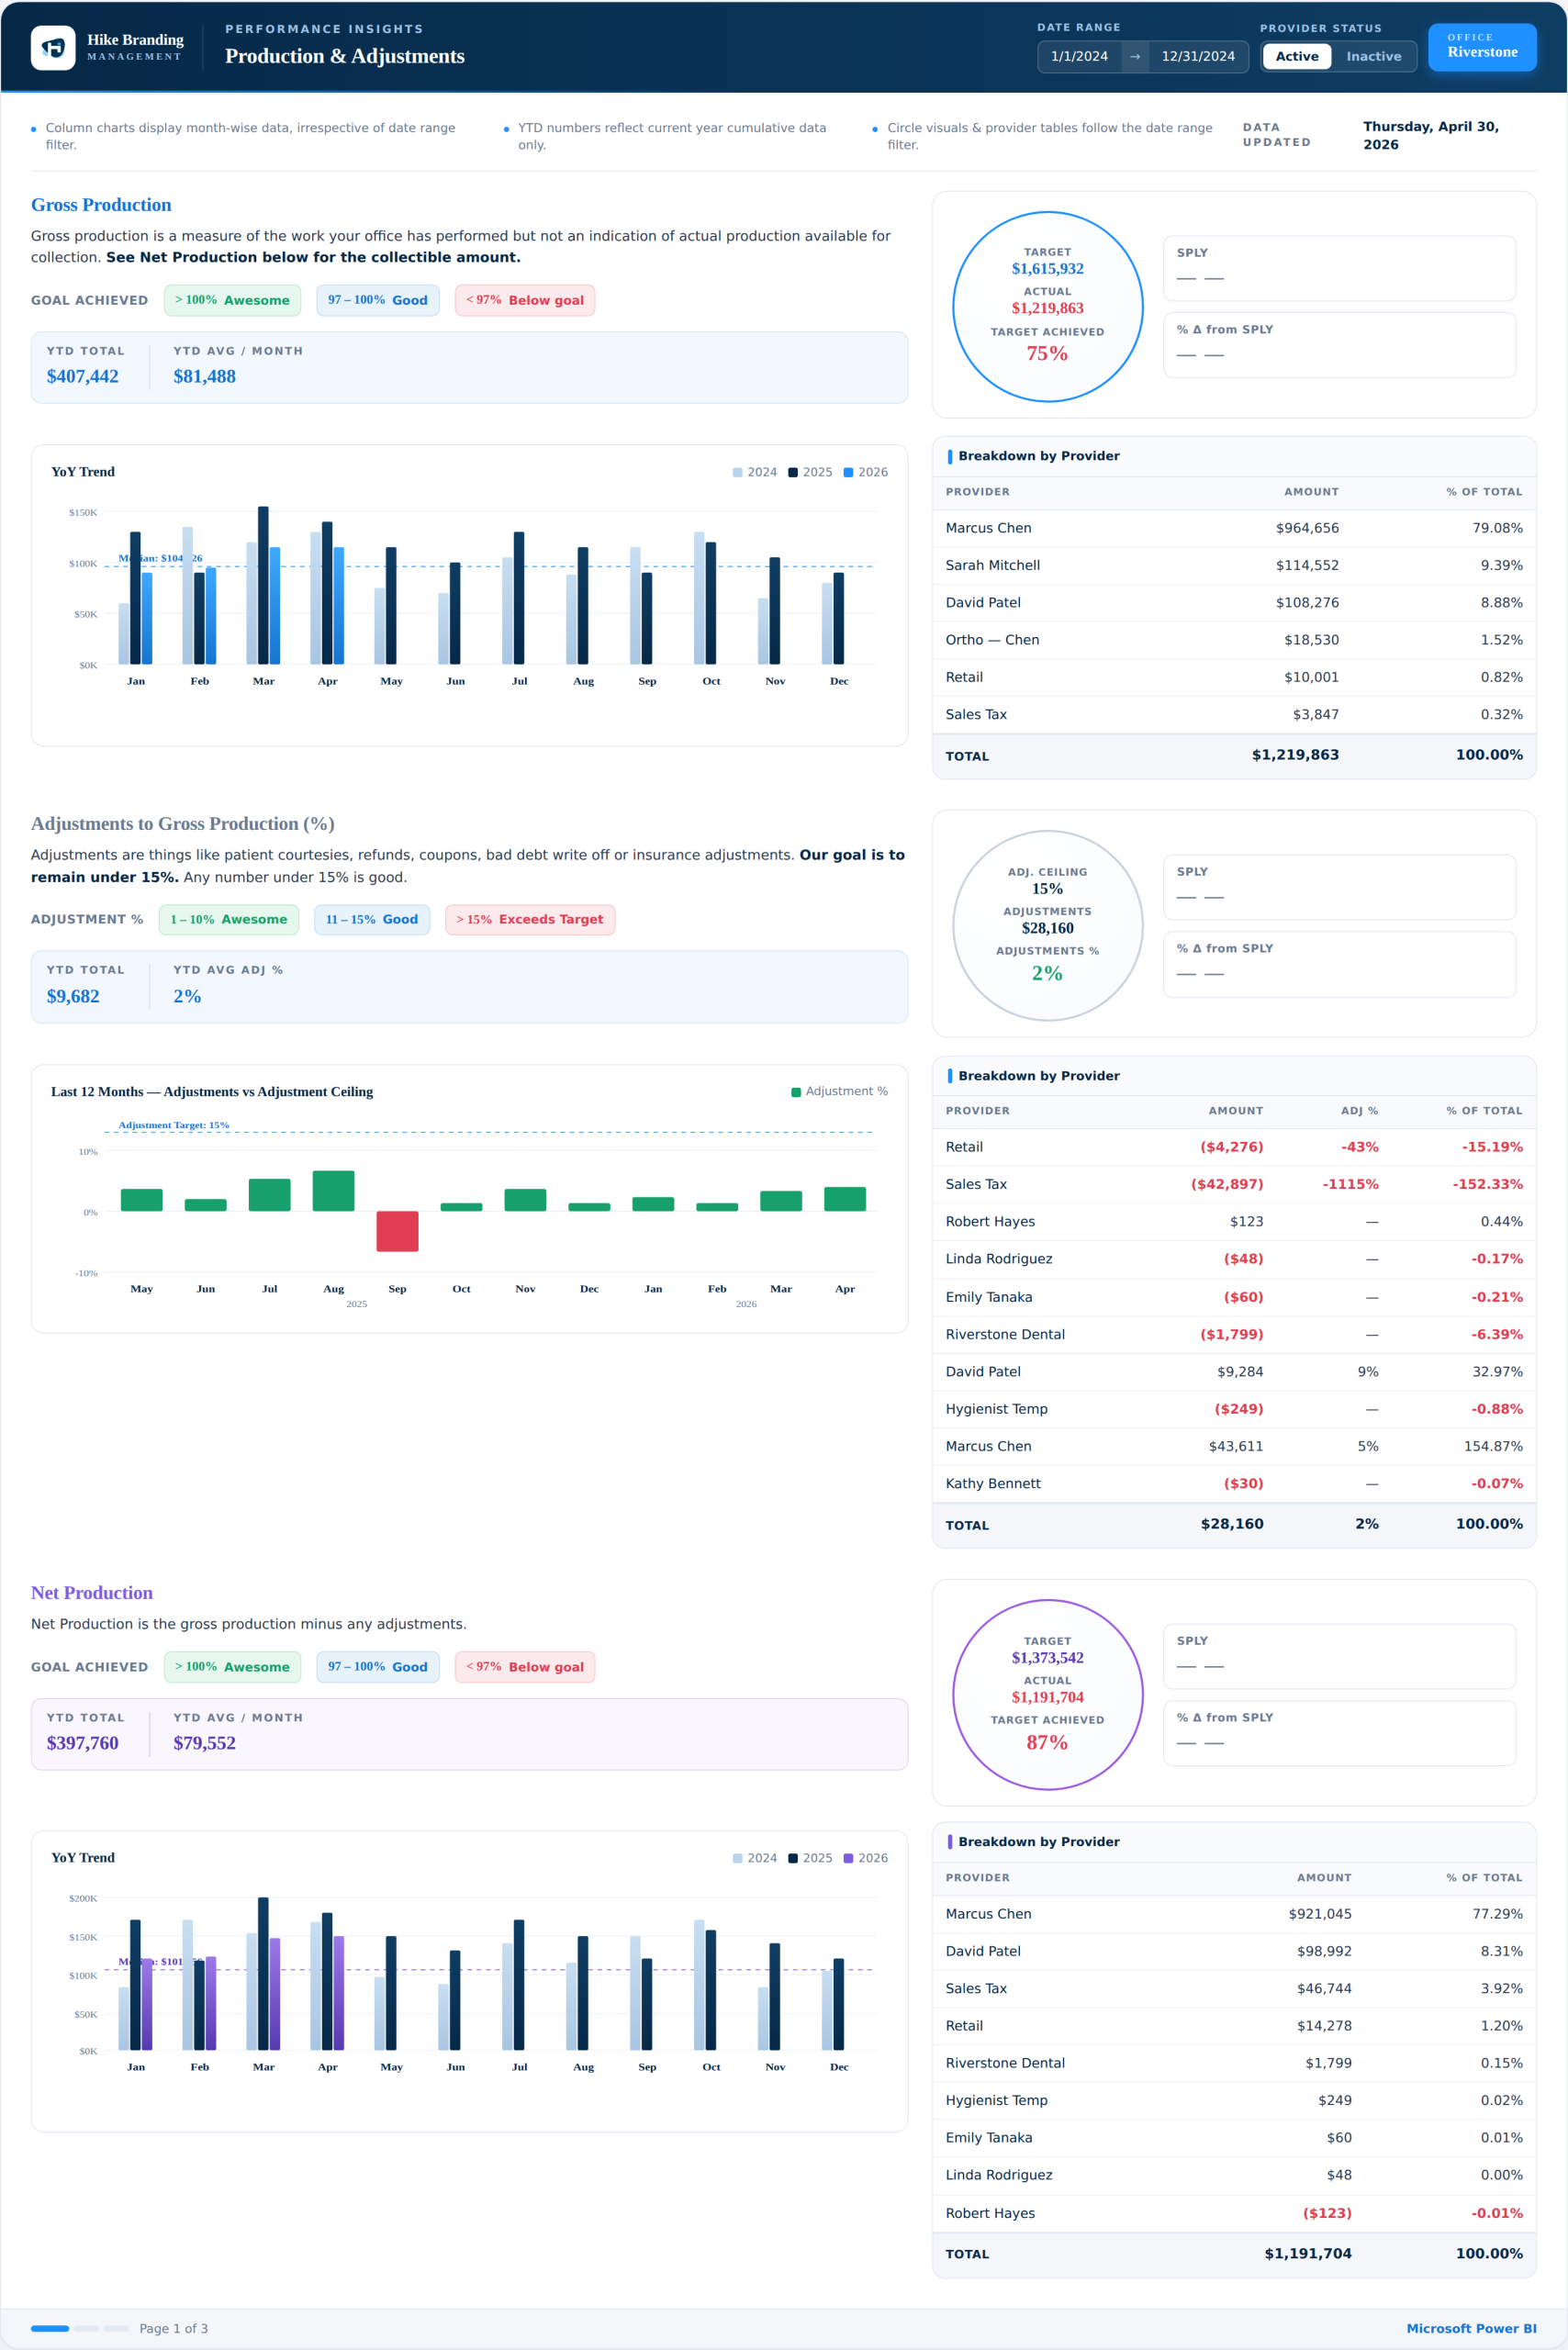
What You See:
Gross Production (YTD & Monthly)
Target vs Actual performance
Provider-wise contribution
Adjustments tracking (refunds, write-offs, insurance changes)
Why It Matters:
Instantly know if your clinic is meeting revenue targets
Identify which doctor drives the most production
Keep adjustments under control (goal: <15%)
👉 This helps owners answer:
“Are we producing enough, and where are we losing revenue?”
2. Collections & Accounts Receivable Dashboard
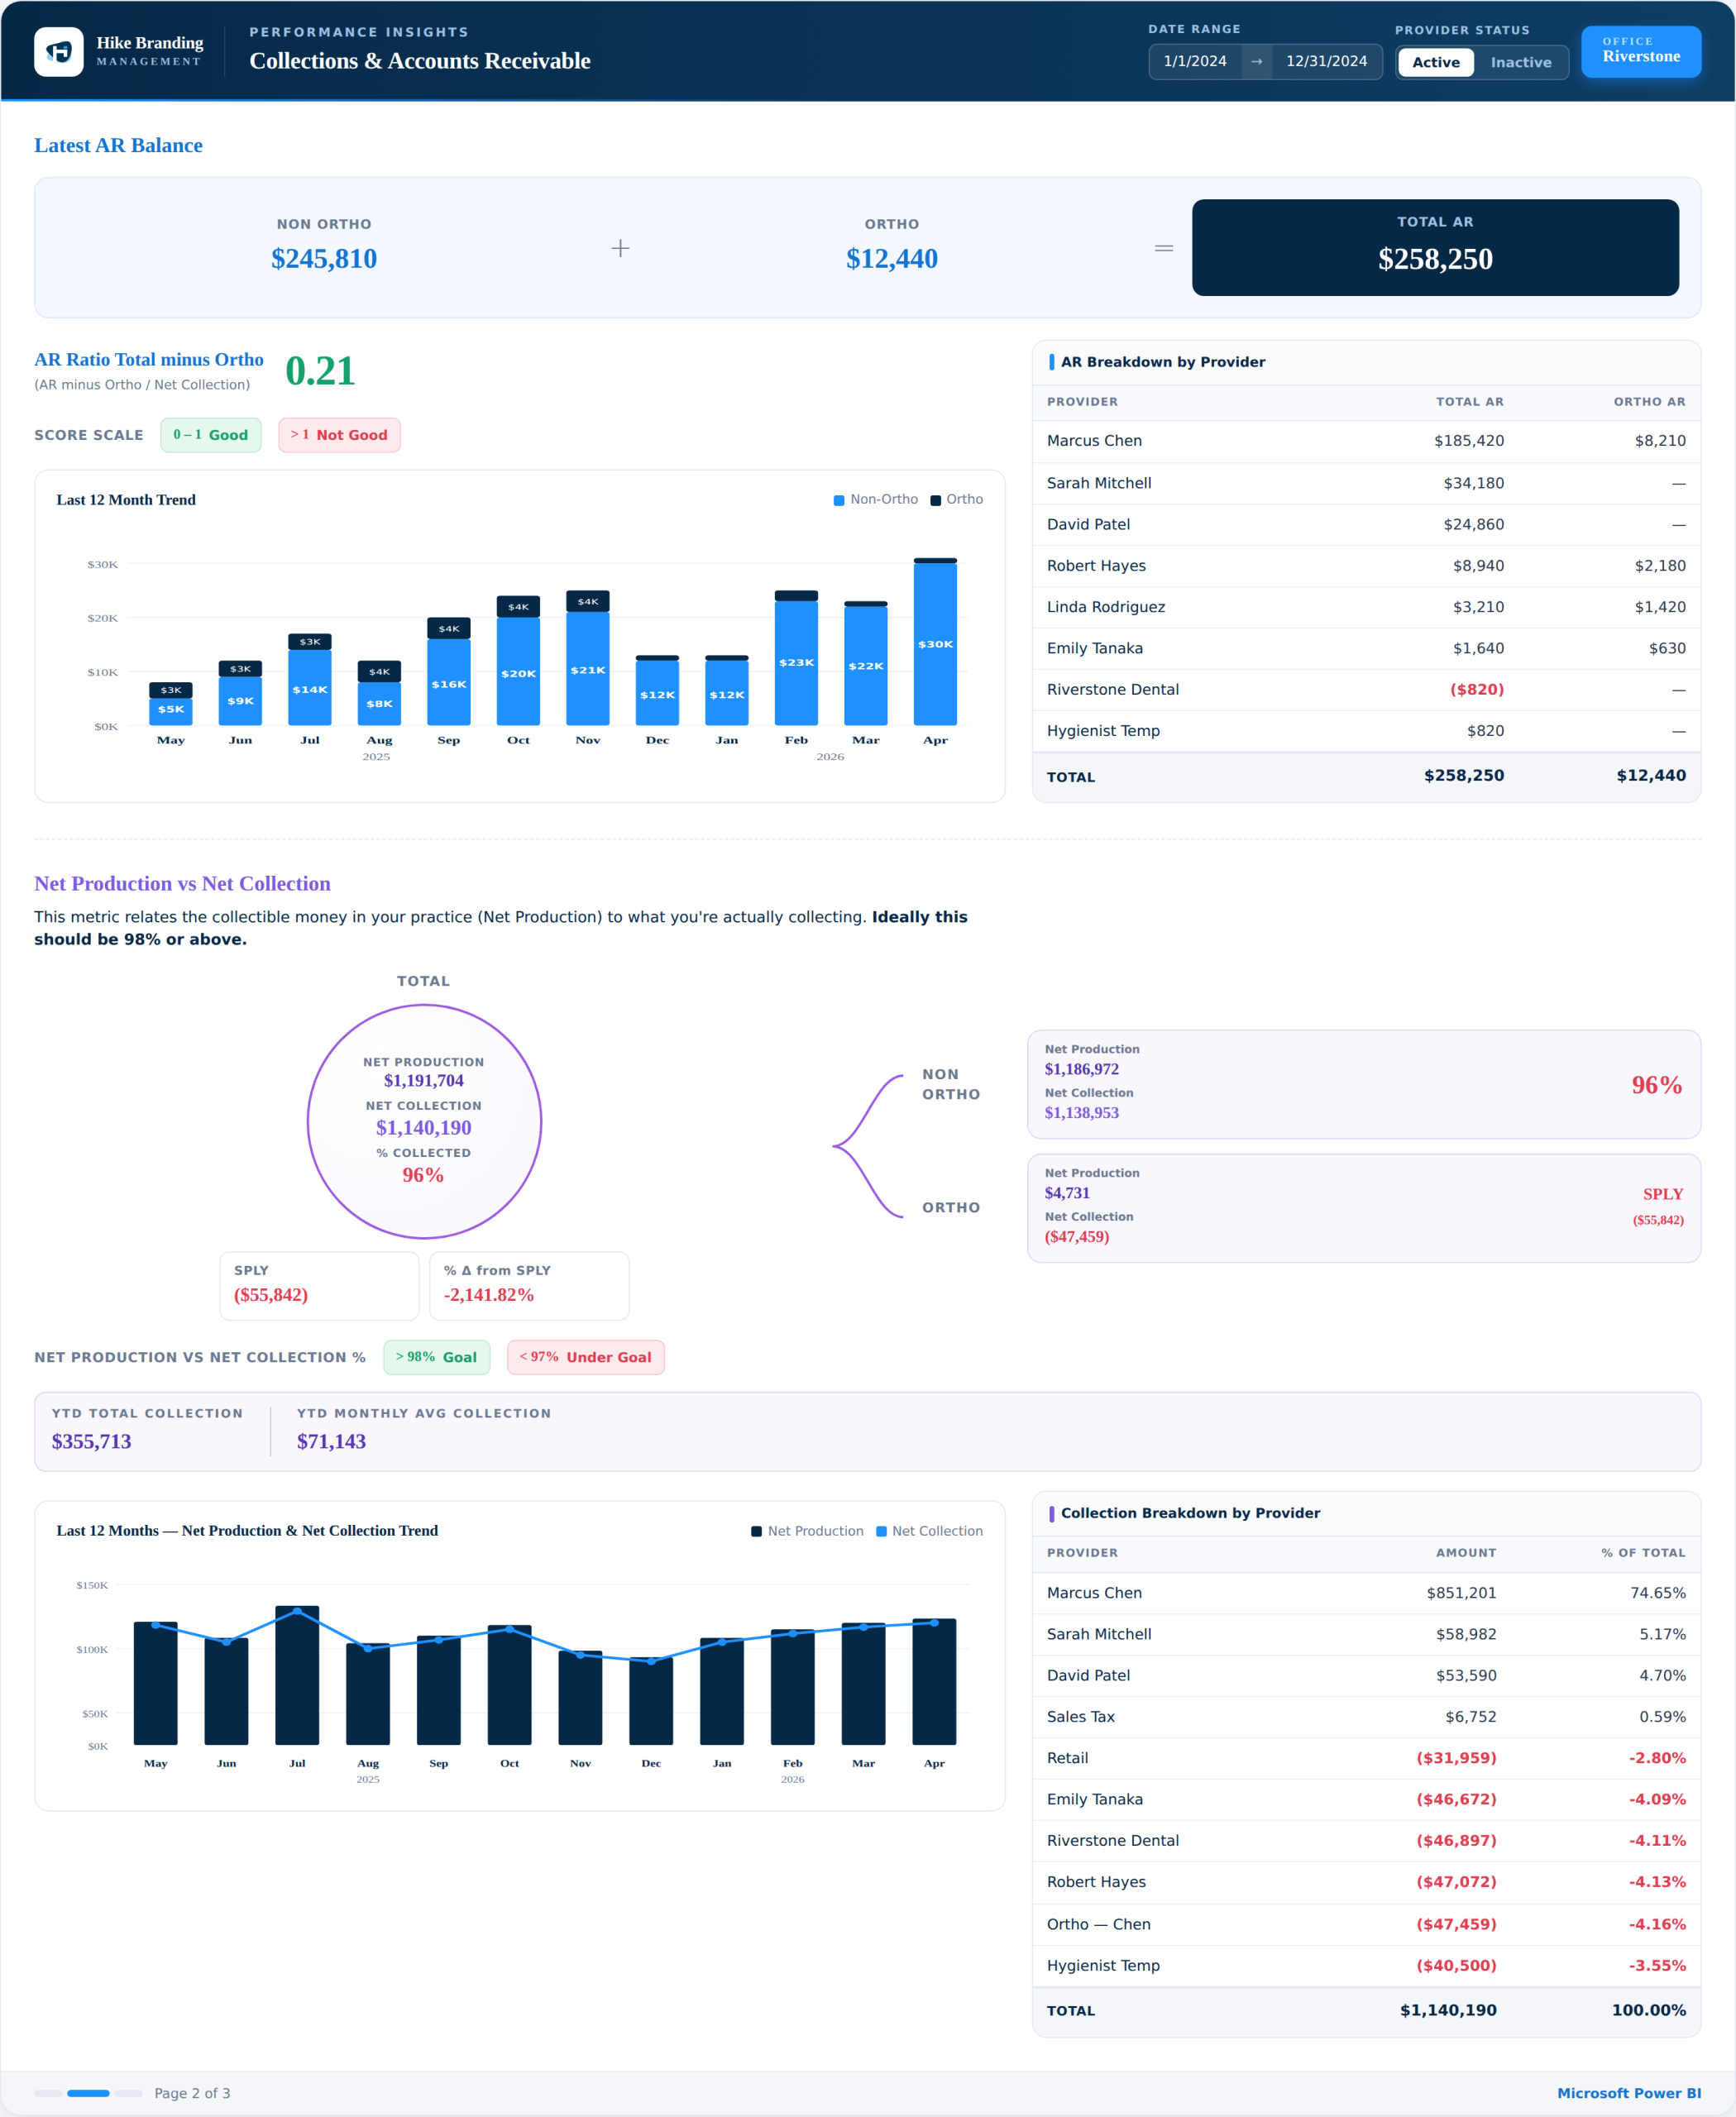
What You See:
Total AR (Accounts Receivable)
Ortho vs Non-Ortho breakdown
Net Production vs Net Collection %
Provider-wise collection performance
Key Insight:
Ideal collection rate = 98%+
Instantly identify cash flow issues
Why It Matters:
Track how much money is actually collected vs produced
Reduce outstanding AR
Improve financial health across clinics
👉 This answers:
“We are producing revenue… but are we actually collecting it?”
3. Patient Production & Activity Dashboard
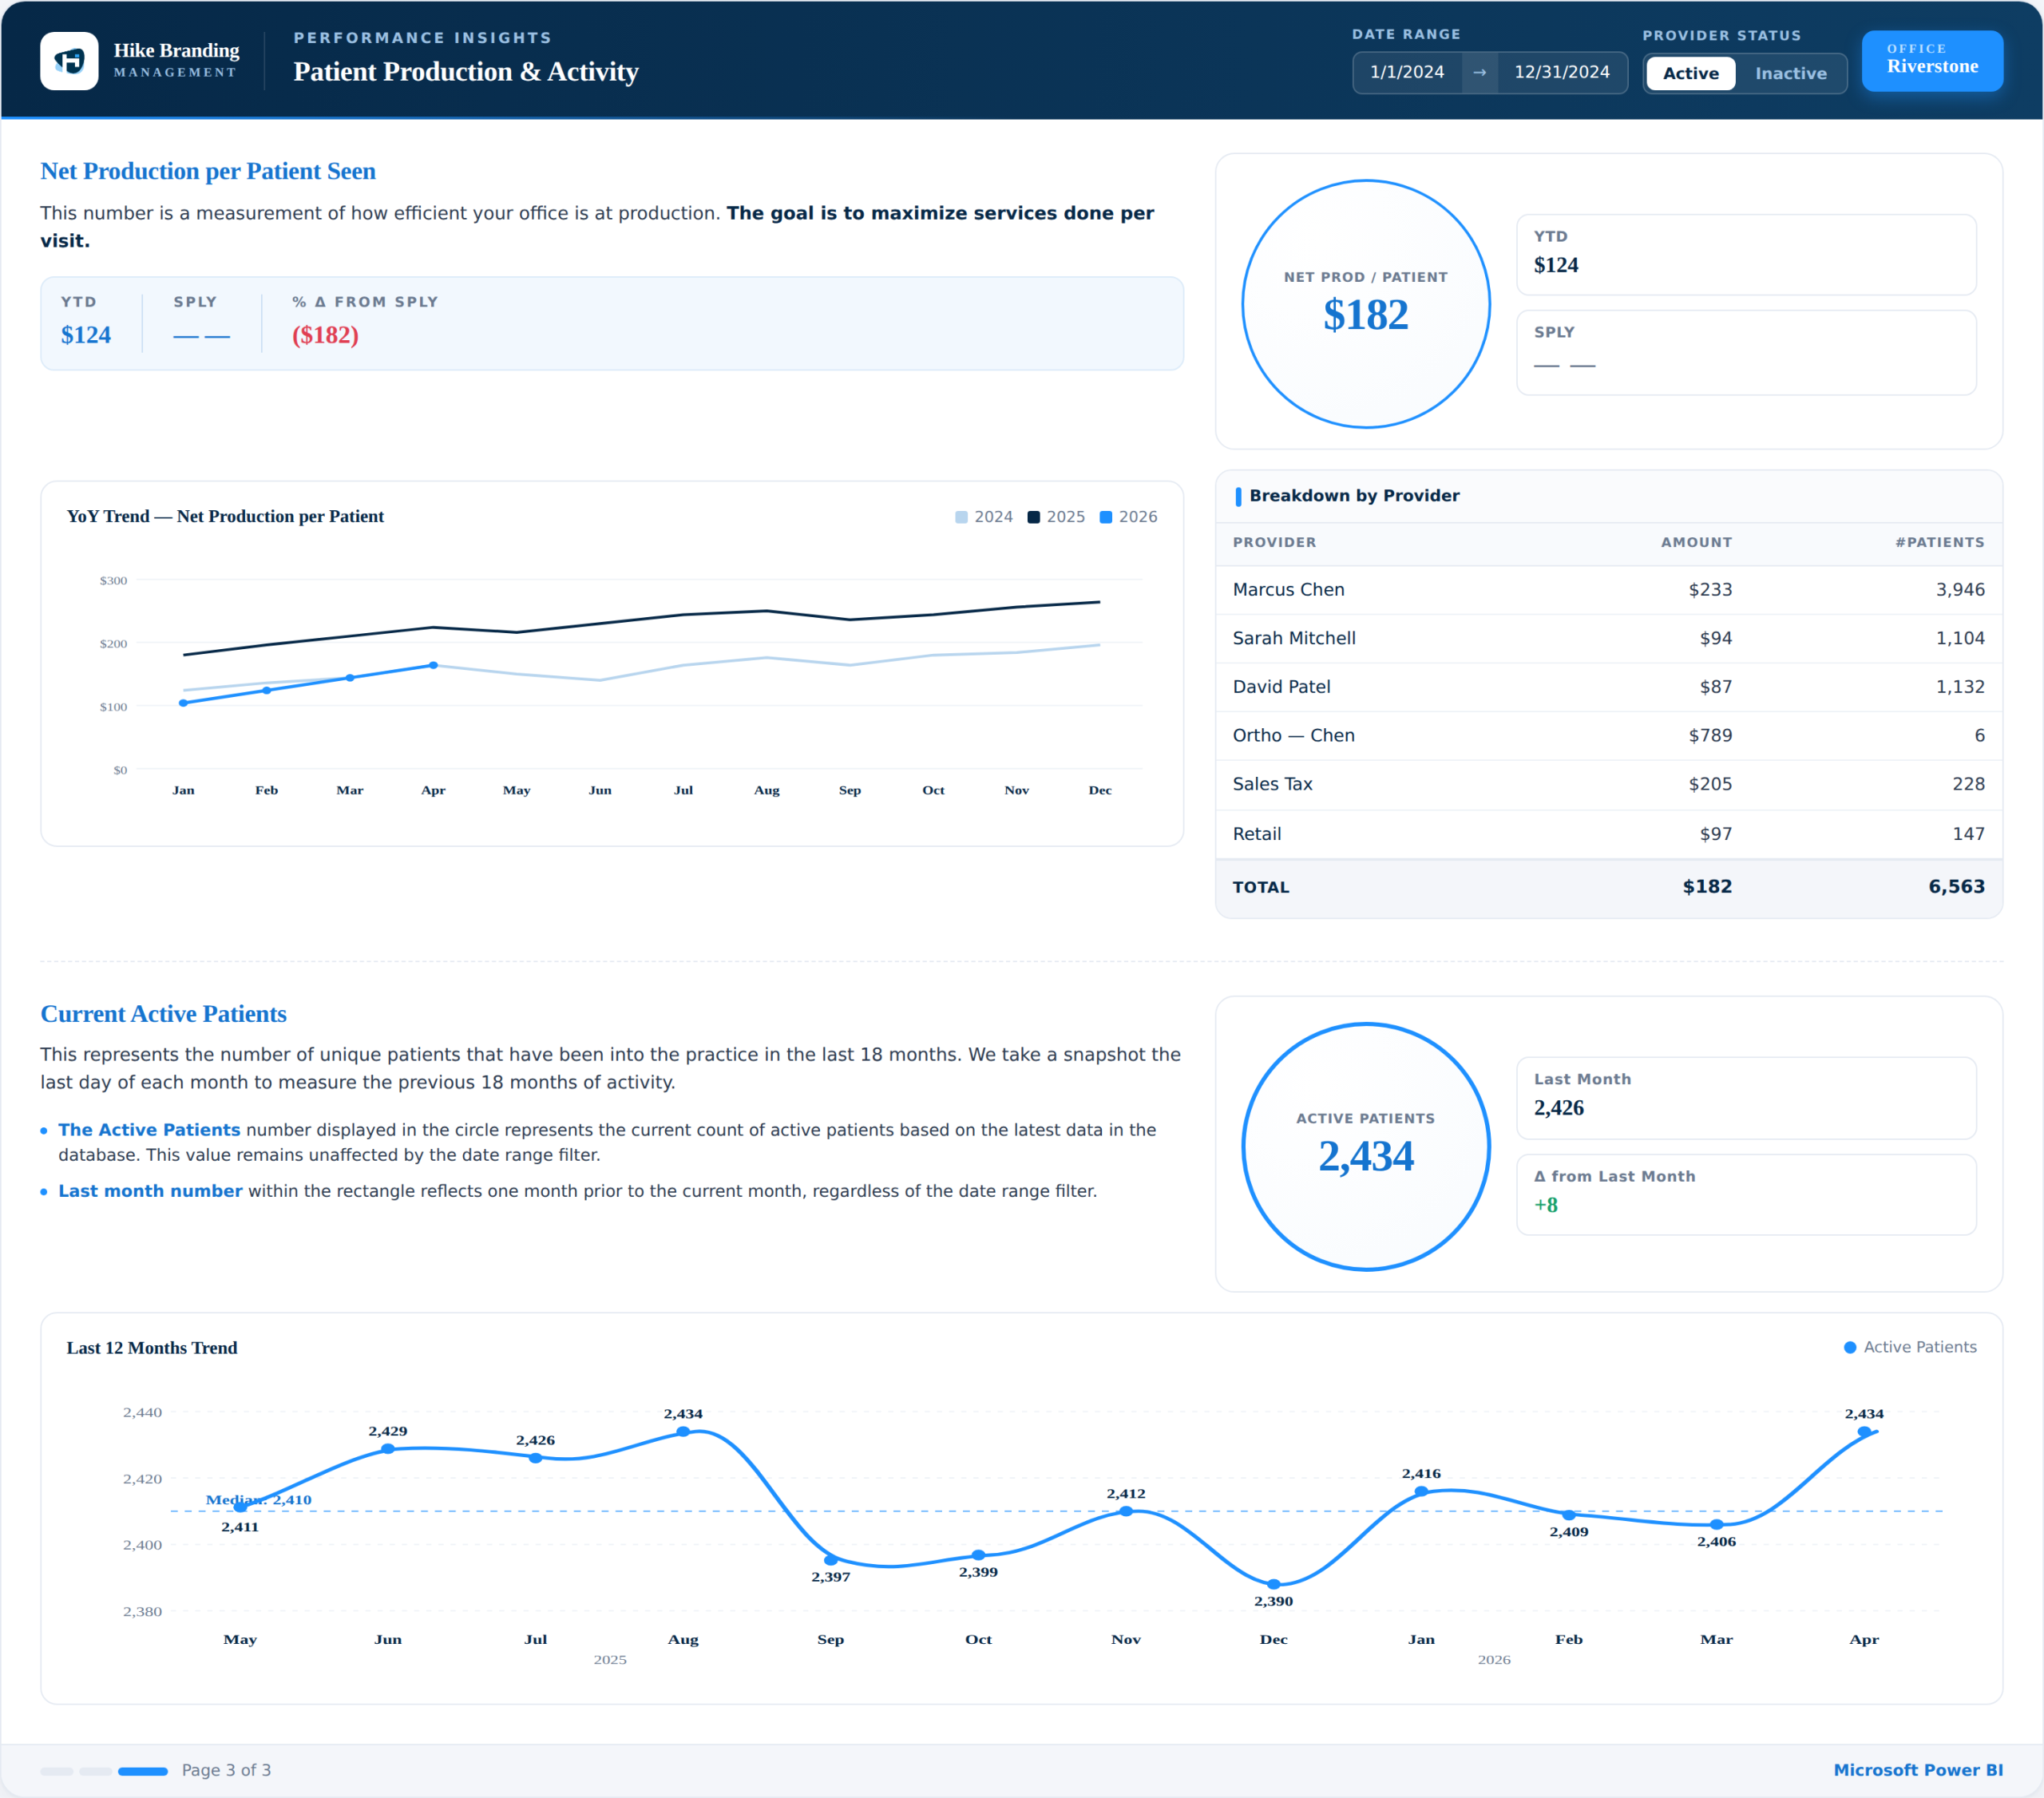
What You See:
Net Production per Patient
Active patient count (last 18 months)
Provider-wise patient efficiency
Monthly patient trends
Why It Matters:
Measure clinic efficiency per visit
Track growth in patient base
Identify underperforming providers
👉 This answers:
“Are we maximizing value from each patient visit?”
Works With Dentrix & OpenDental
We support:
Dentrix Desktop (G6.2 or higher)
Dentrix Ascend (Cloud)
OpenDental systems
Integration Flow:
Dentrix / OpenDental → Middleware → Cloud Database → Power BI Dashboard
Real Use Case (Dental Chain)
We implemented this system for a multi-location dental practice in Arizona (7 clinics).
Results:
📉 Reduced manual reporting by 80%
📊 Unified all clinic data into one dashboard
⚡ Faster decisions with daily insights
📈 Improved production tracking & accountability
Why Dental Chains Choose Hike Branding
Deep expertise in Dental CRM + Analytics
Proven system already working in real clinics
Custom dashboards tailored to your KPIs
Scalable for multi-location practices
Final Thought
If you’re running multiple clinics and still relying on spreadsheets, you’re missing growth opportunities every day.
A centralized dashboard is no longer a luxury—it’s a necessity for scaling dental practices.
Want to See This for Your Clinic?
We can set up a similar dashboard for your practice using Dentrix or OpenDental.
Contact us today: https://hikebranding.com
Email: [email protected]